Back to the route Next stop: Transit COVID Campaign
Real-Time Displays
Real-time departure boards and on-bus next-stop screens, redesigned for legibility within legacy hardware limits that are currently installed across YRT’s bus fleet and bus terminals.
- Role
- UI/UX Designer
- Organization
- York Region Transit
- Timeline
- 2019 to 2022
- Worked with
TL;DR
Passengers lacked clear real-time context, and the legacy displays were outdated and restrictive. Working with the Transit Technology team, I redesigned bus terminal departure boards and on-bus next-stop displays, stress-testing type for distance and long destination names, and turning subjective data like bus occupancy into something passengers could read at a quick glance.
- 2Display typesDeparture boards at terminals, and next-stop screens on board buses
- 500+Buses equippedThe on-bus design runs across YRT’s current fleet
- 15Transit facilitiesThe departure board design is in use at major YRT terminals and TTC subway stations
The Problem
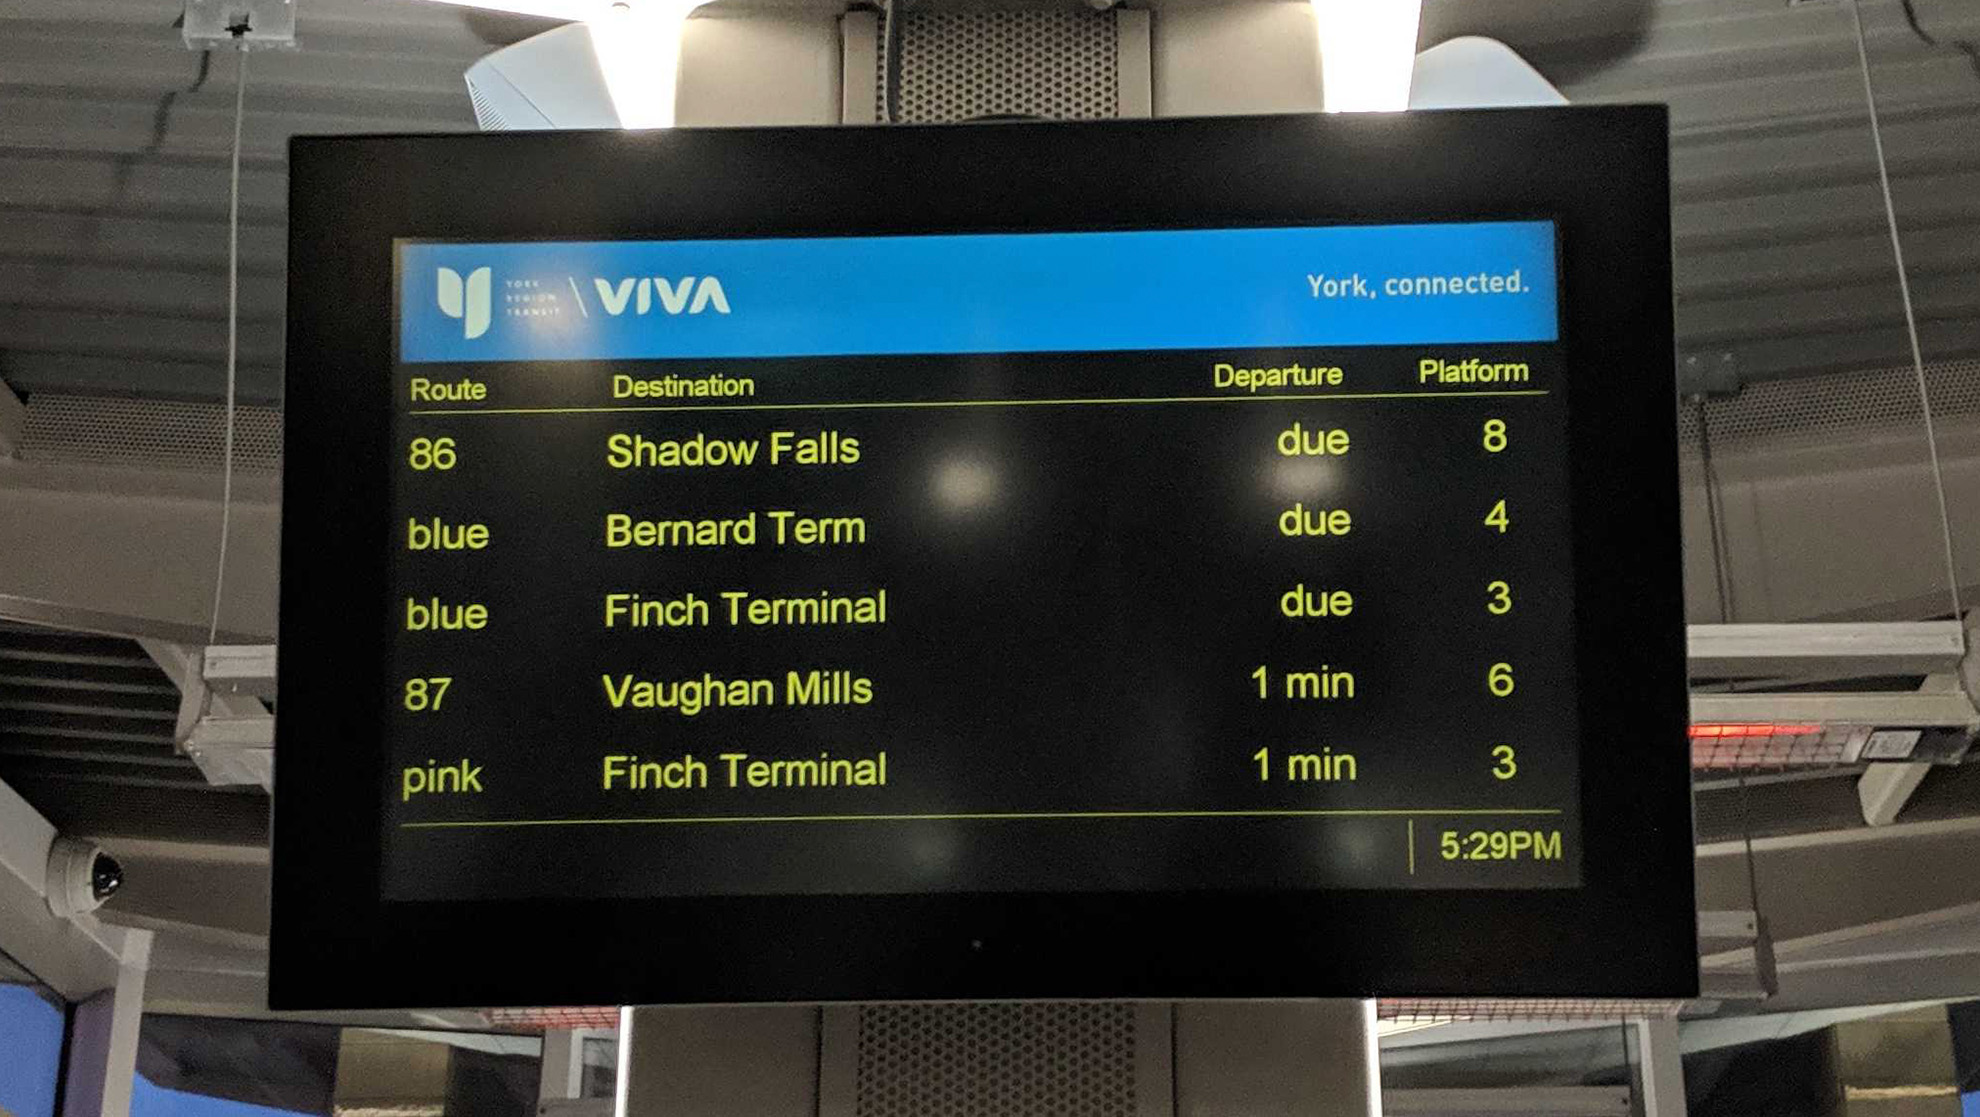
The legacy departure boards and next-stop displays came with limitations: fixed hardware, backend character limits and templates that varied by facility. Destination names were often truncated. Commuters tend to read from a distance or on the move with limited time to wait out the full scroll. And during the pandemic, the team was asked to show how full each bus was.
Key Decisions
1. Design departure boards for people in motion
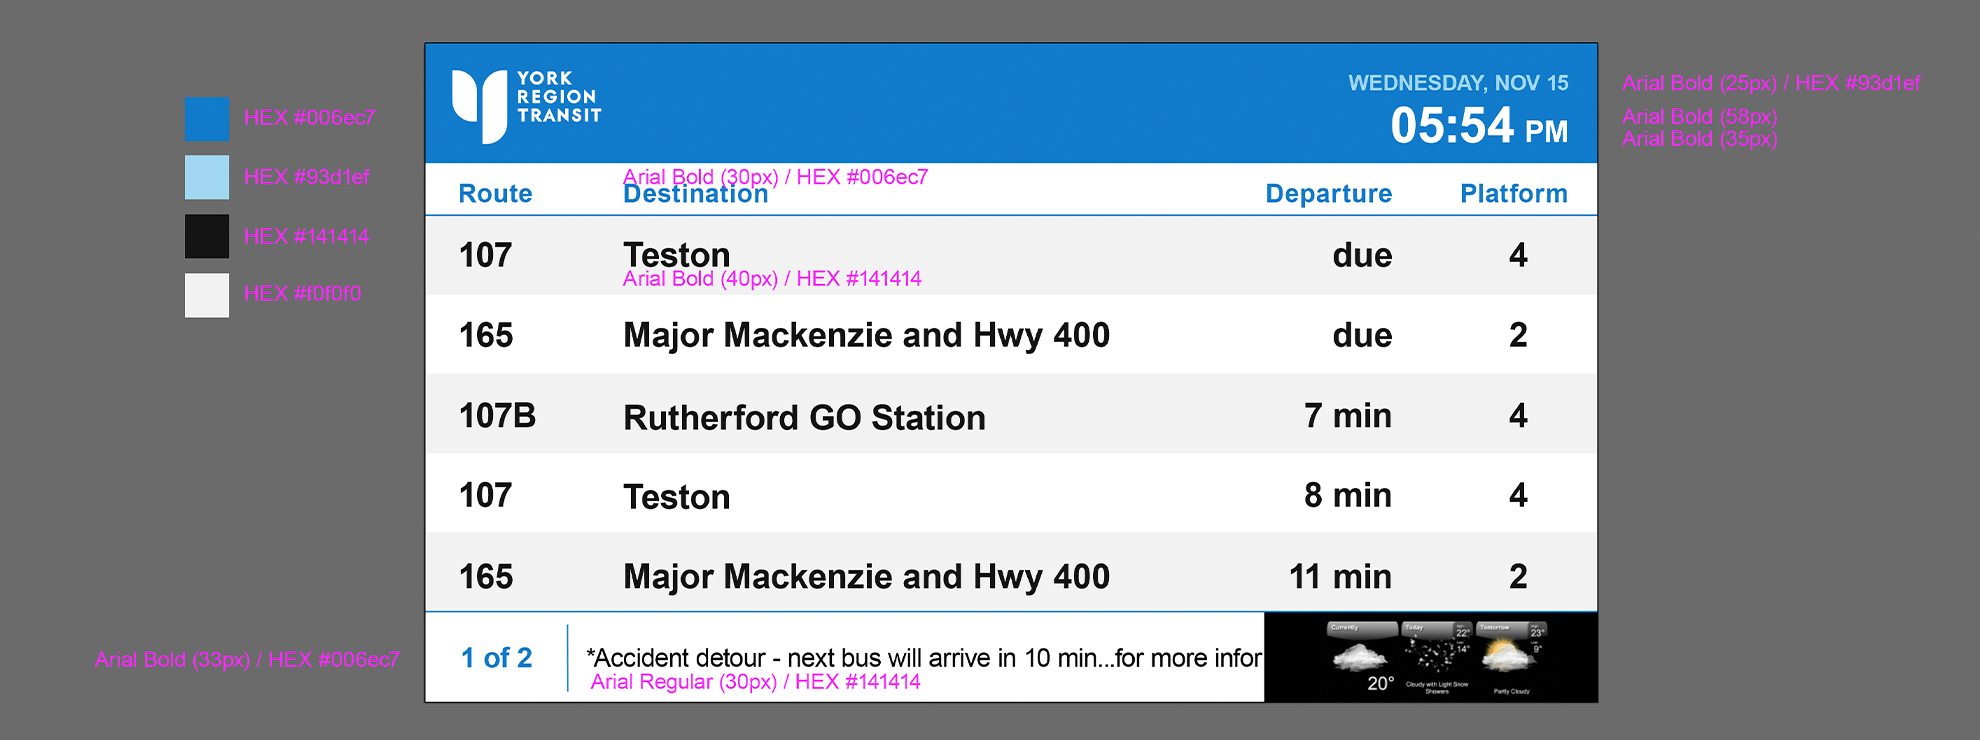
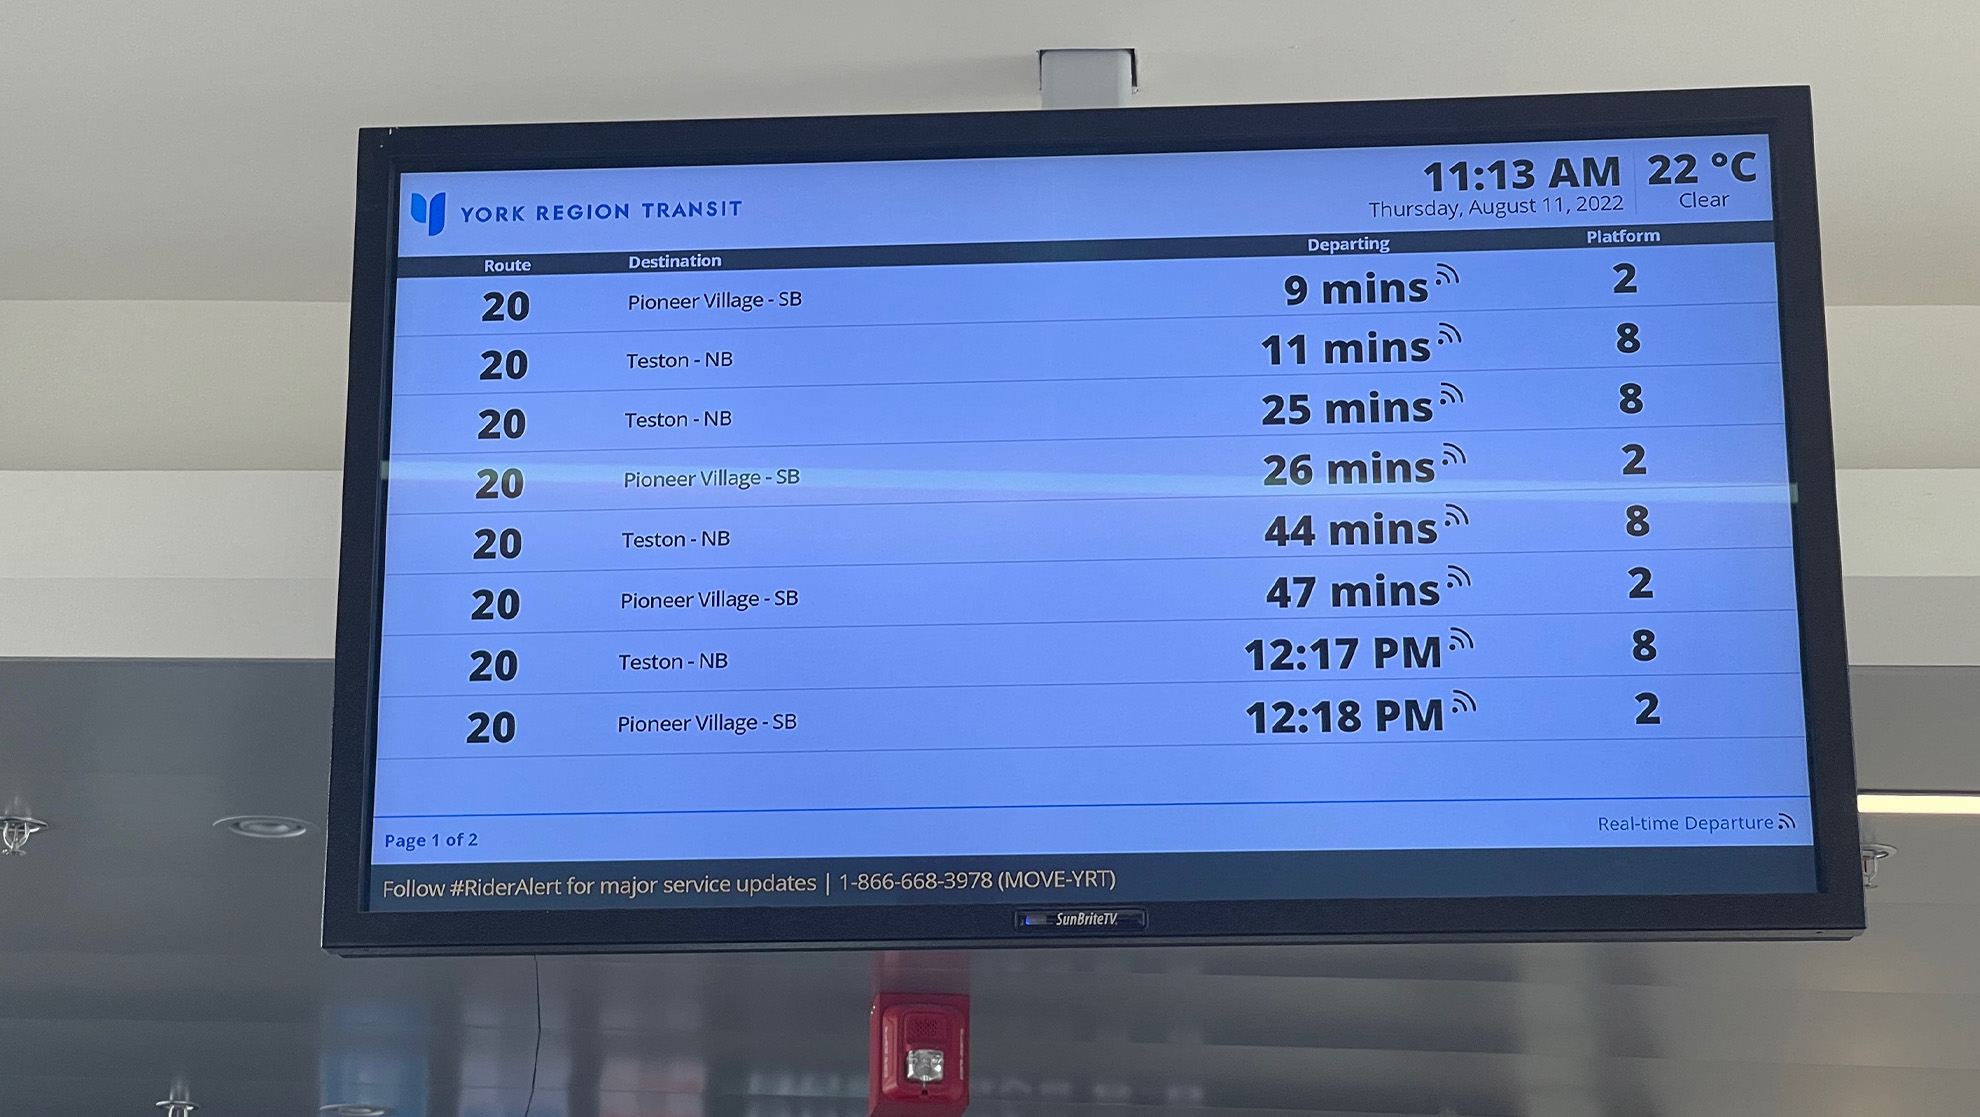
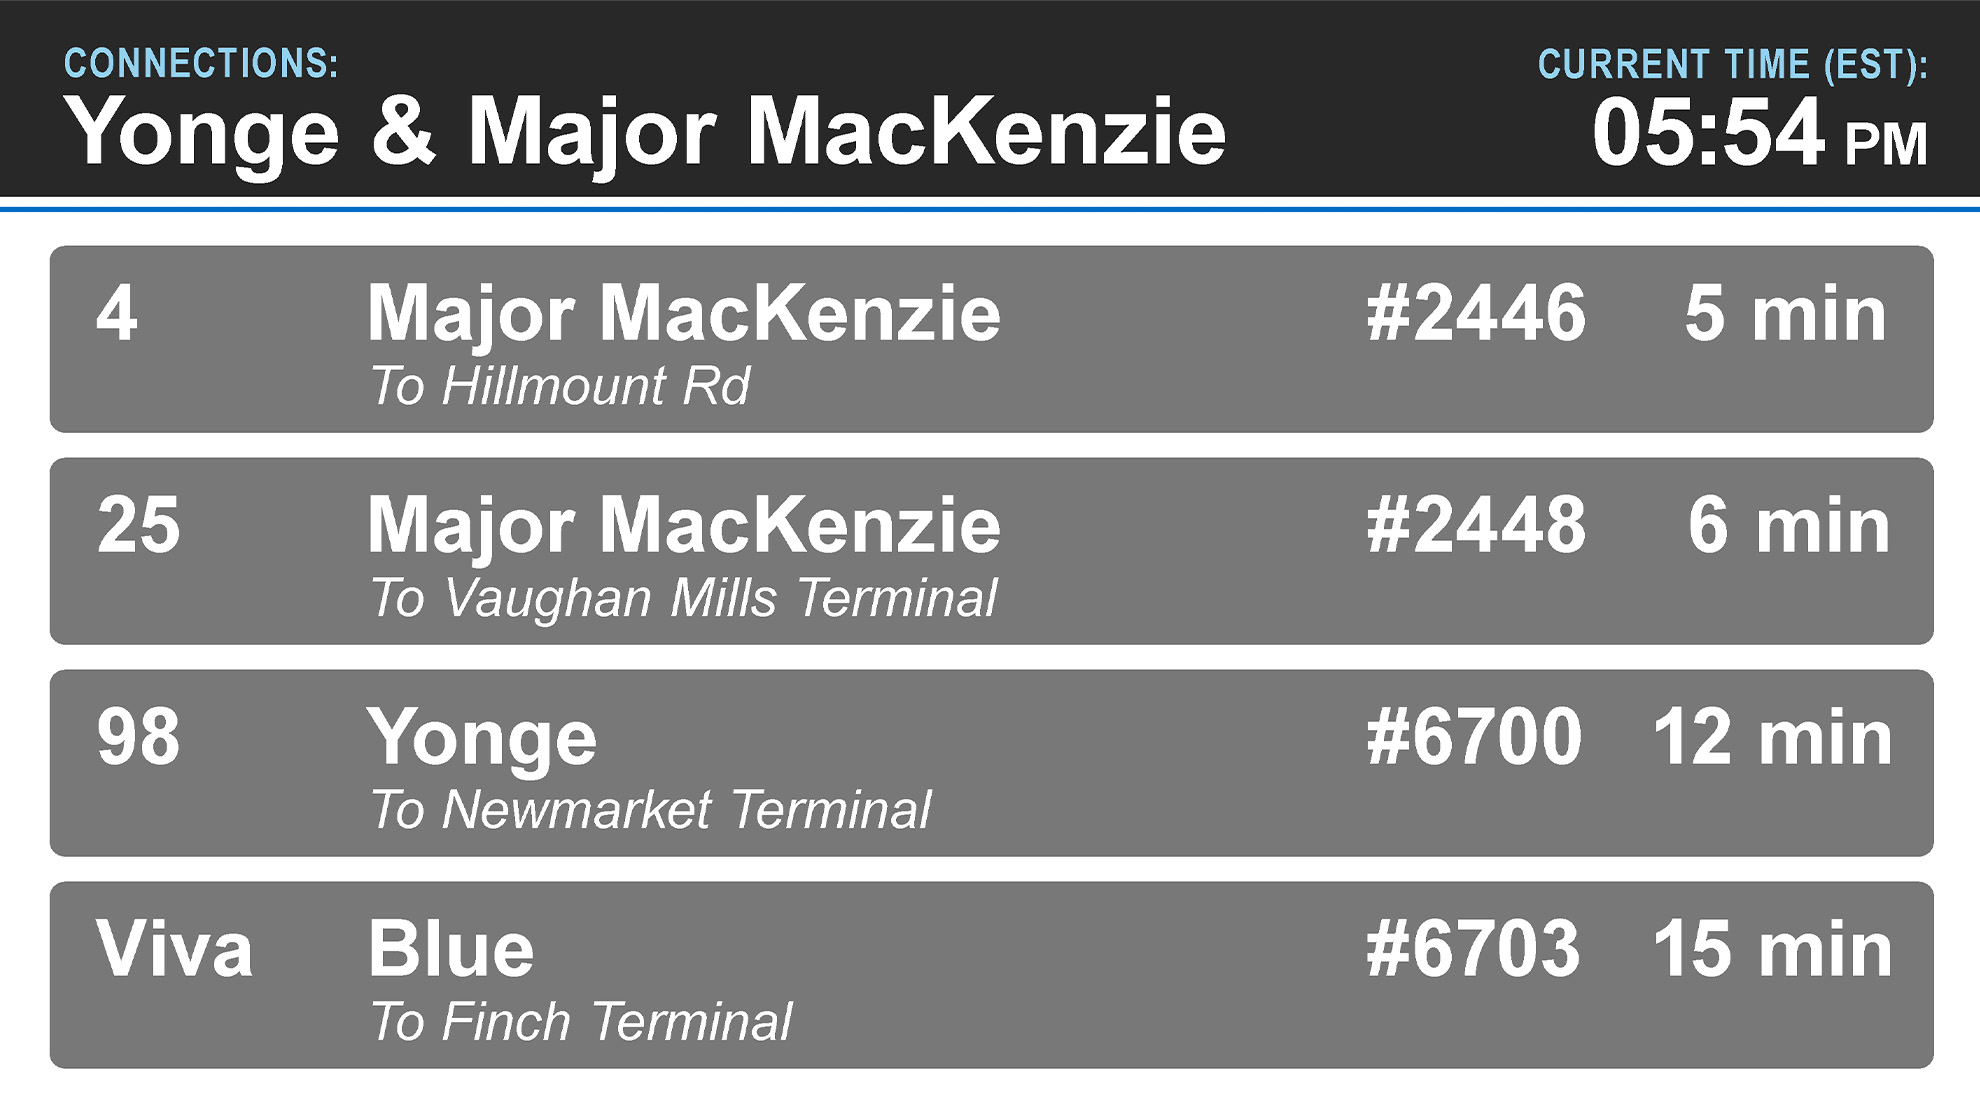
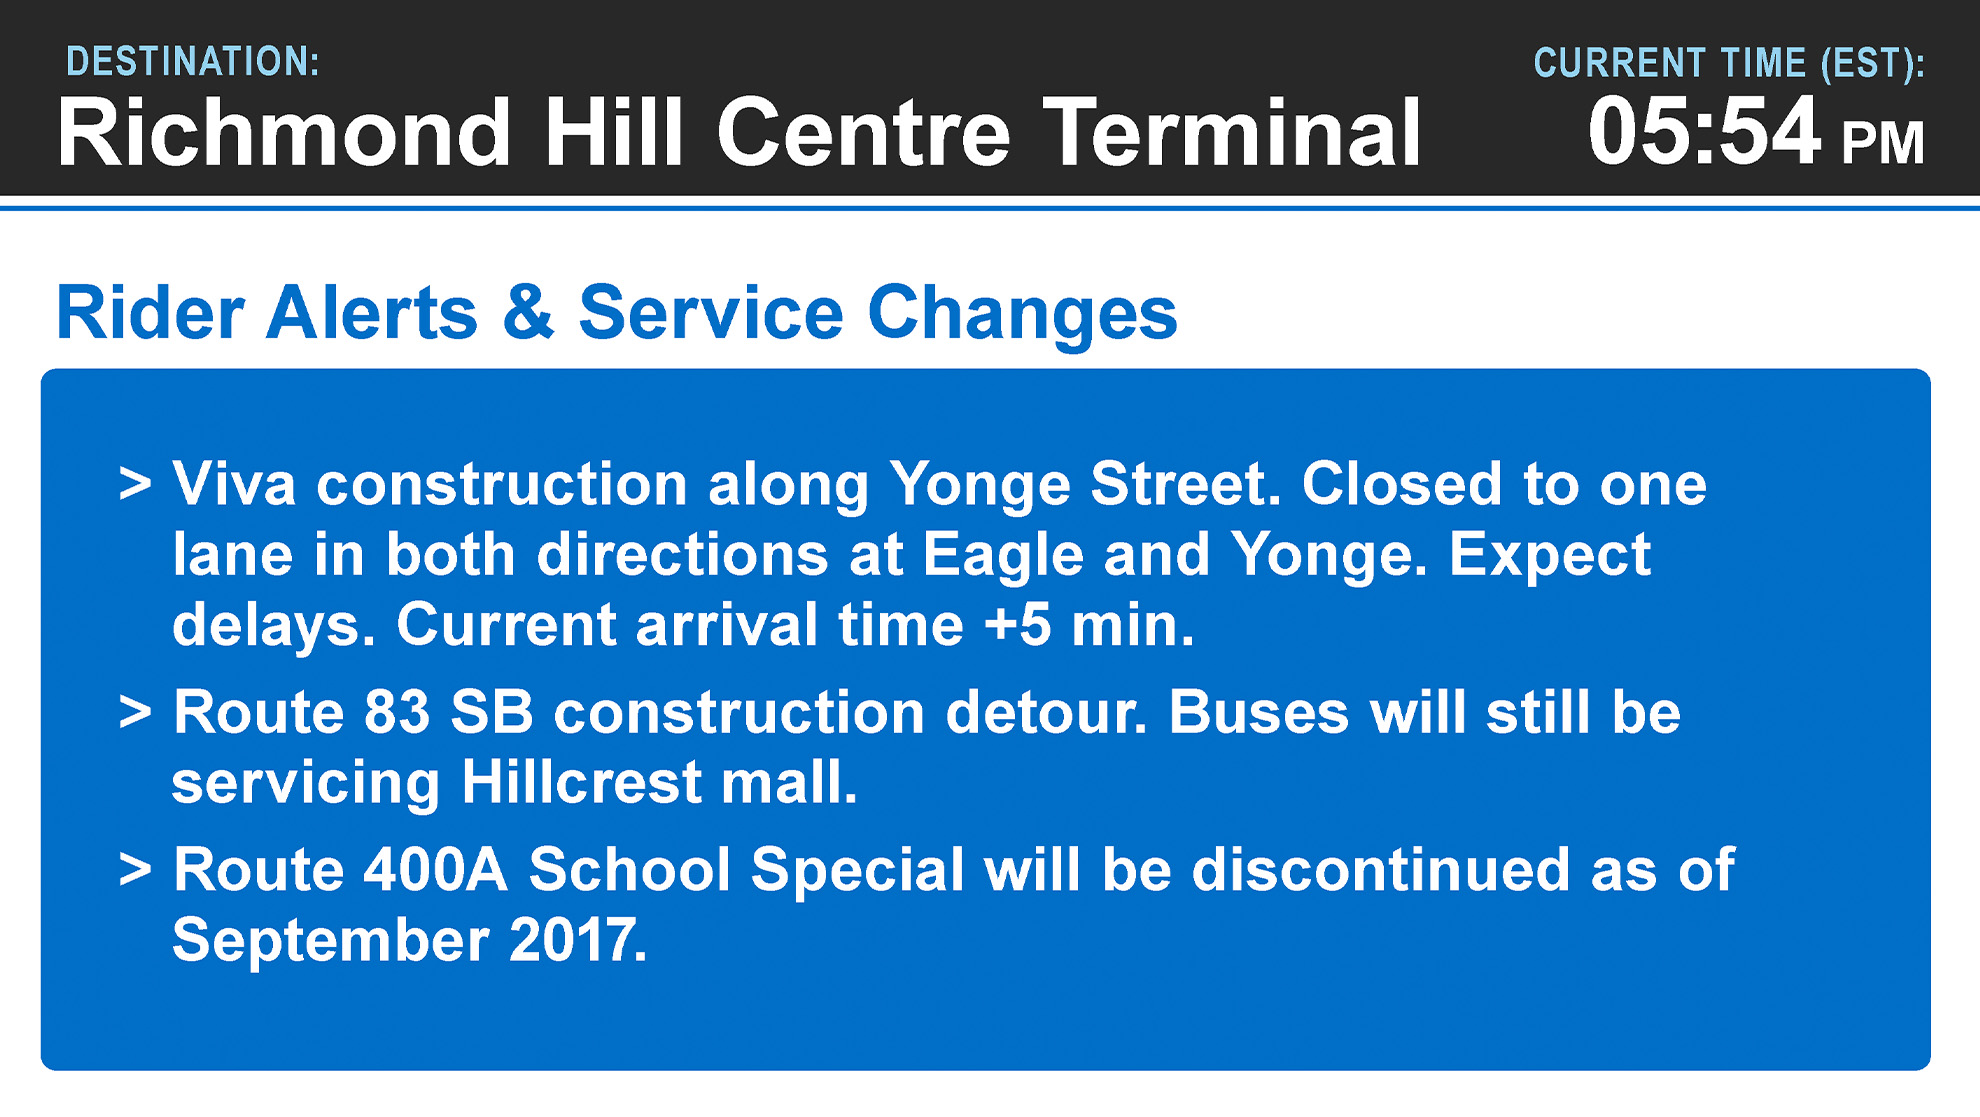
At locations like Richmond Hill Centre Terminal (RHCT), passengers sometimes read the board from far away while in a hurry to make their transfers. I enlarged the date and time, adjusted the destination column so long names aren’t needlessly truncated, and added a page indicator so passengers know more departures are coming. A real-time icon also helps differentiate live departures from scheduled ones, and any bus leaving within one minute turns its whole row blue so commuters can spot it without reading every time.
2. Make occupancy data meaningful
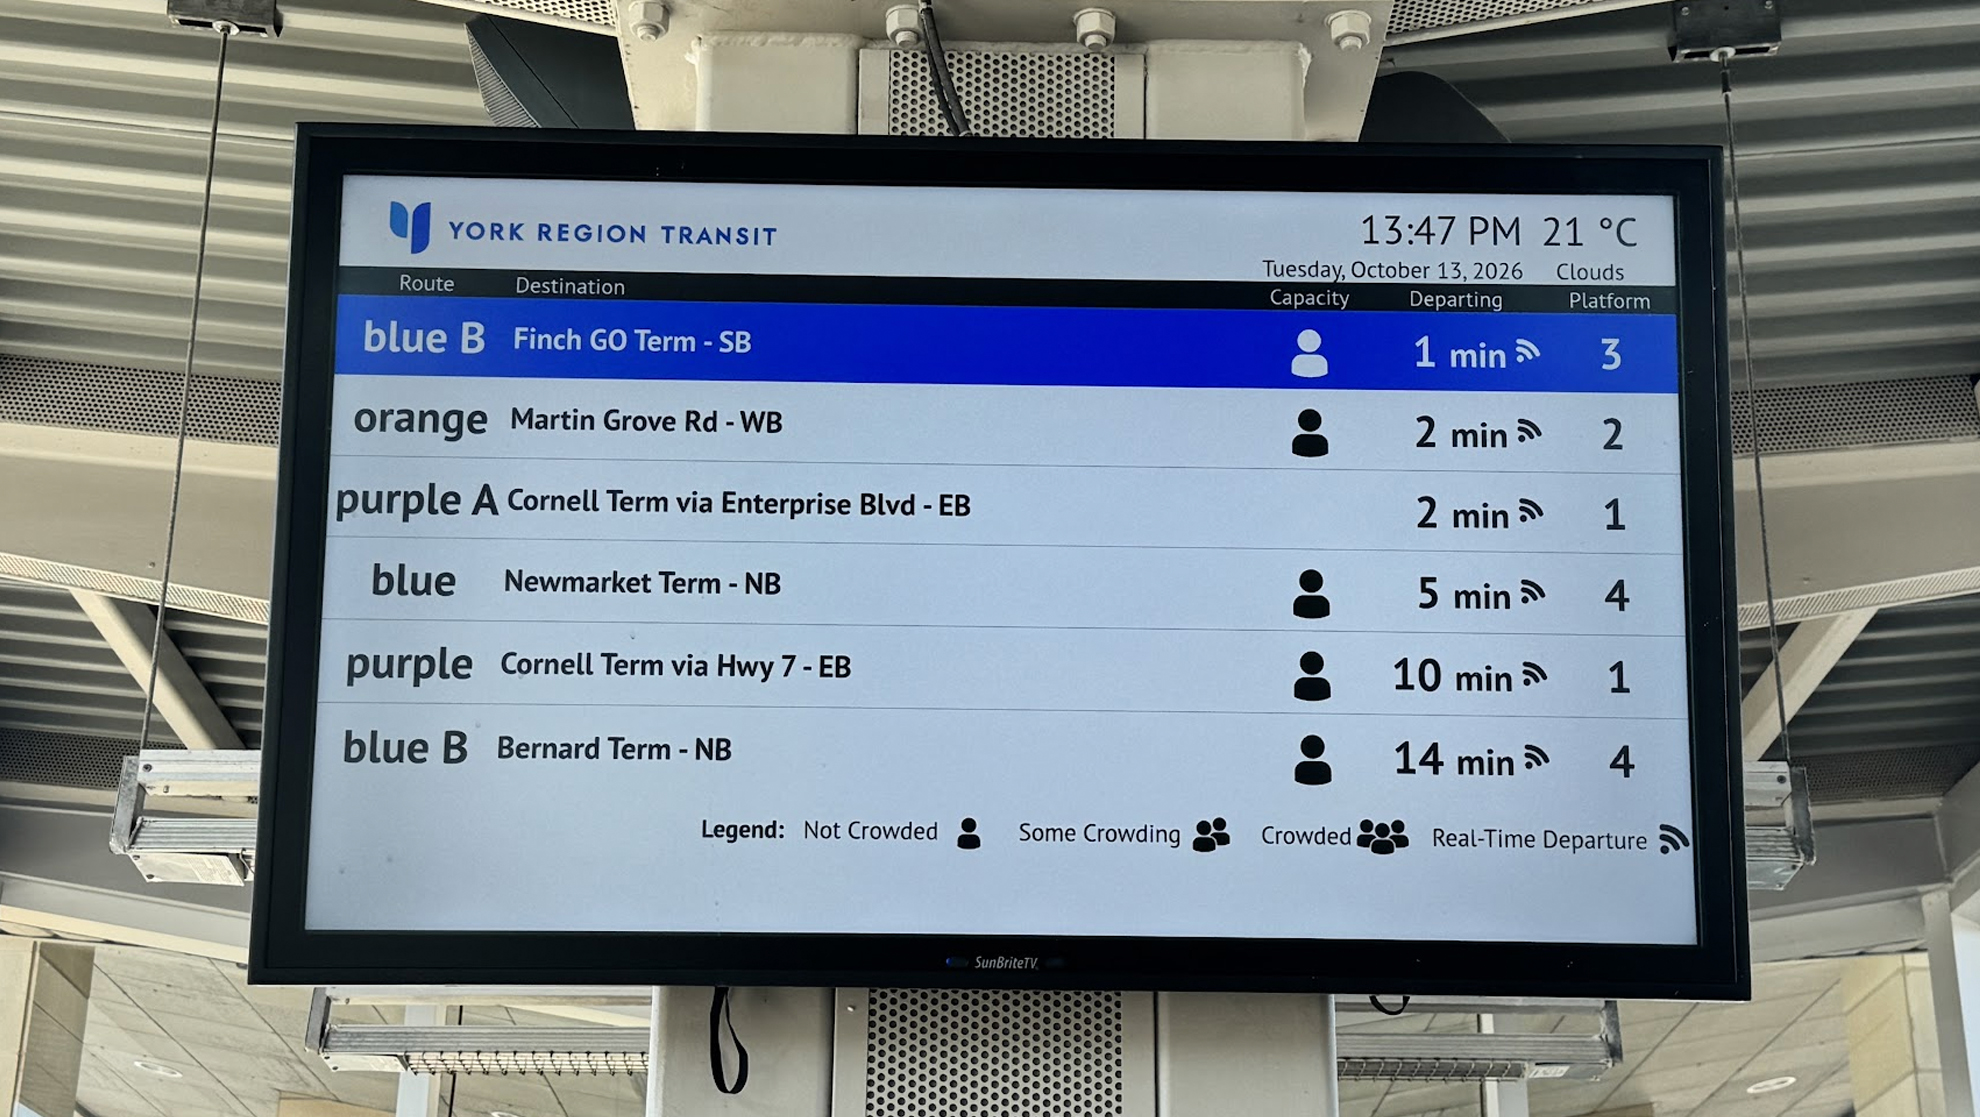
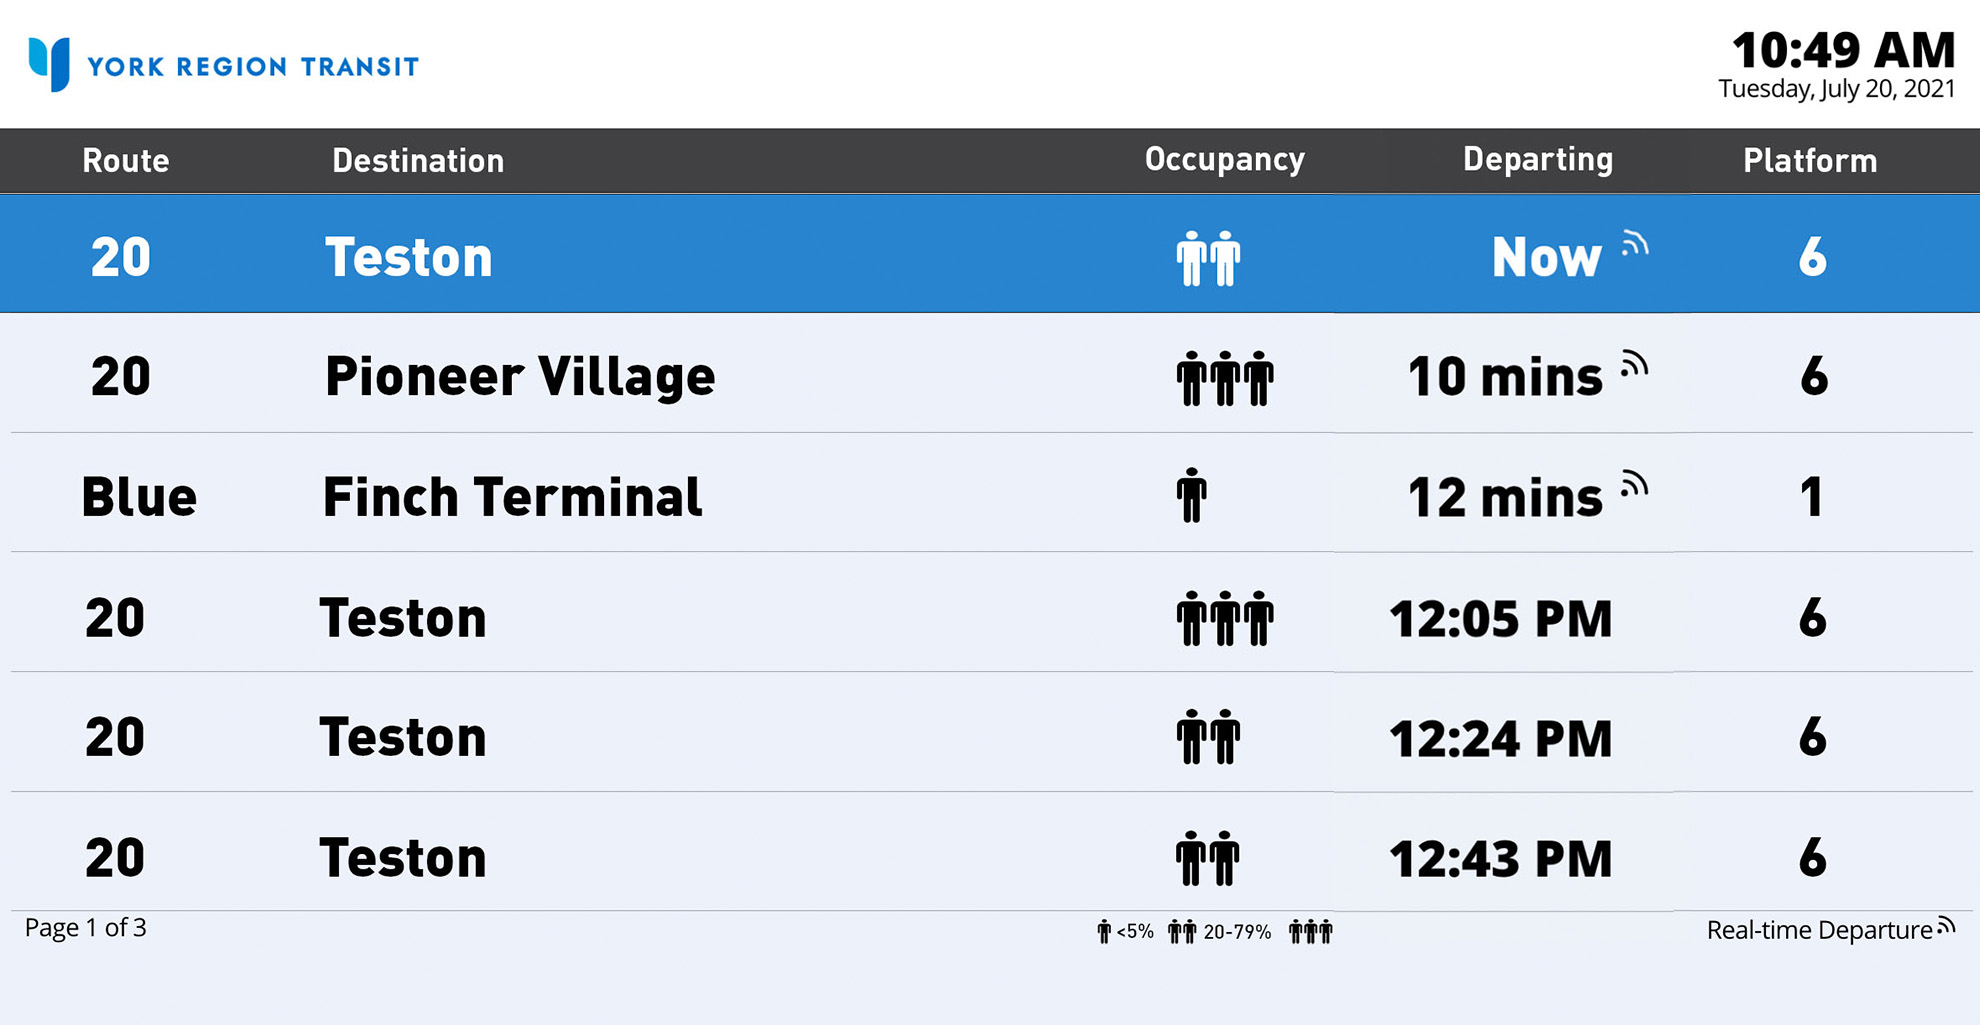
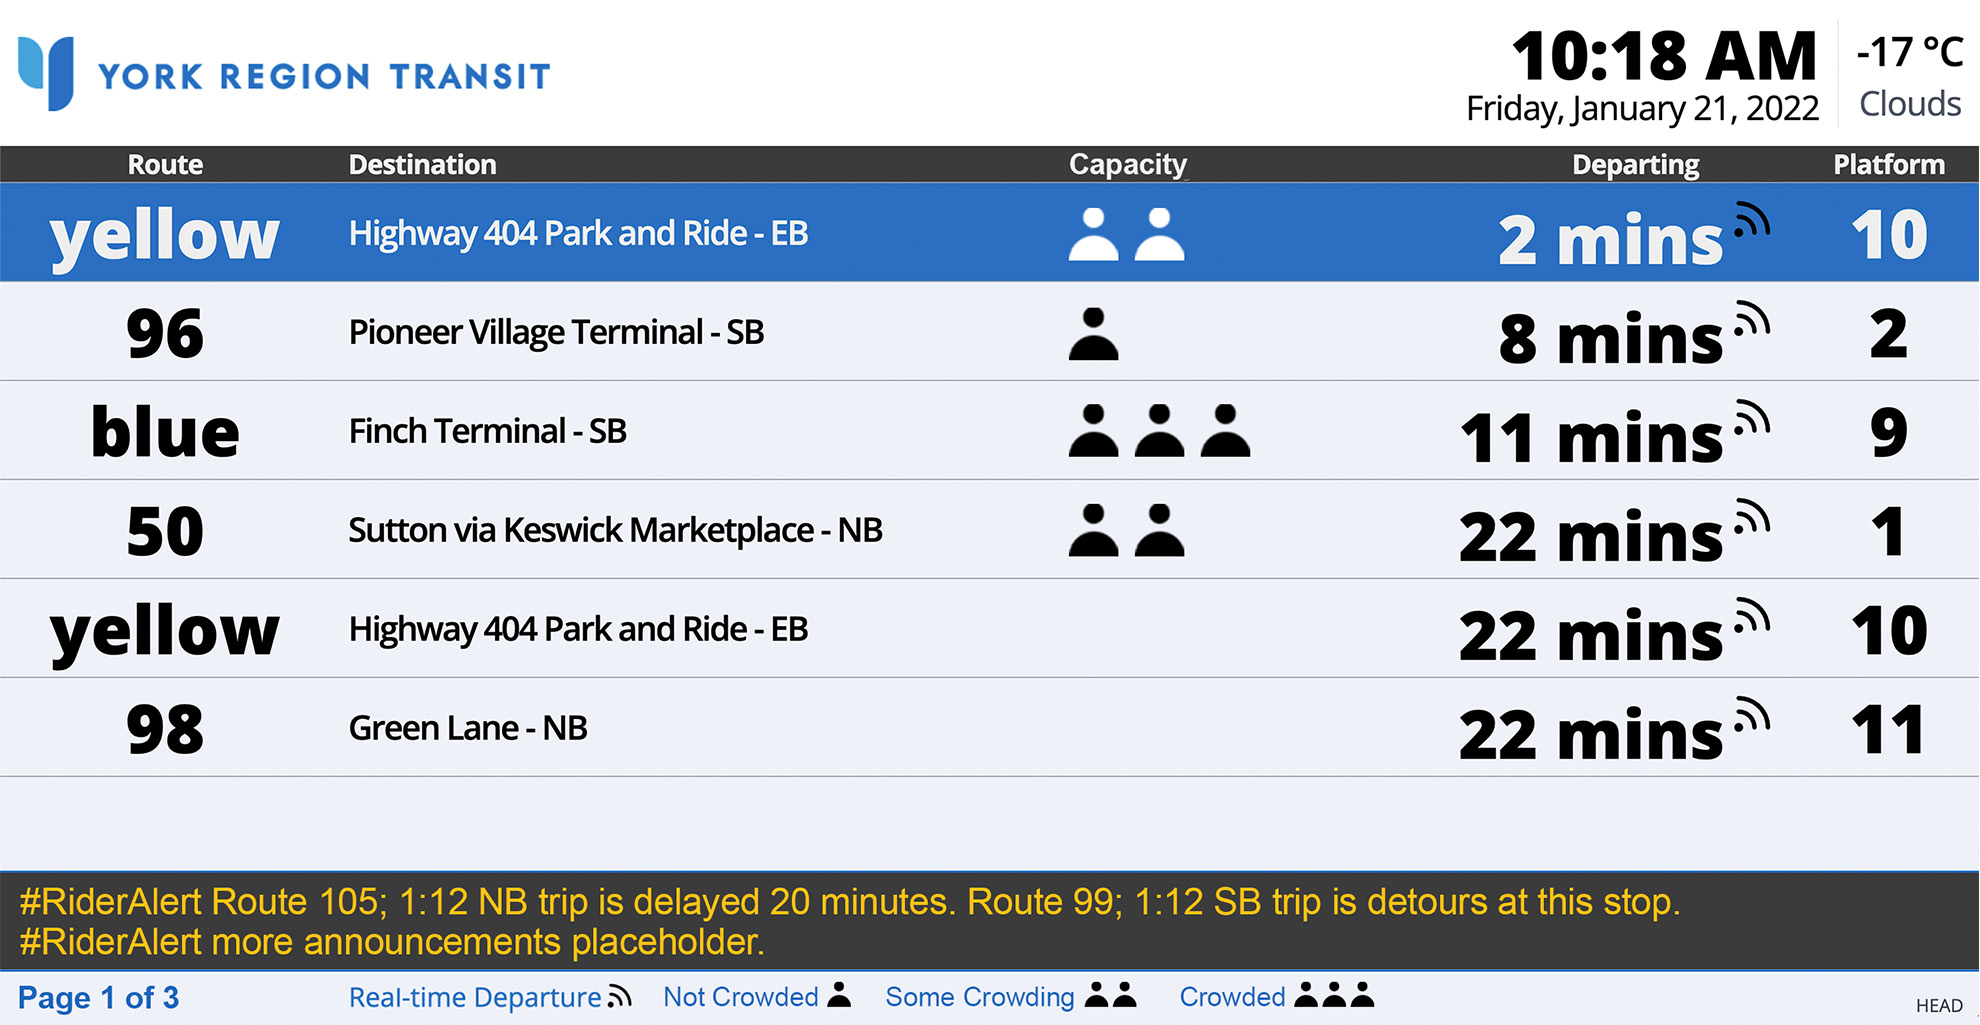
Fractions like “1/3 full” are subjective (is that actually 1/3 of seats taken, or just a handful of people?). We first explained it with percentages, then switched to plain-language labels (Not Crowded, Some Crowding, Crowded) so passengers could judge at a glance.
3. Show the journey without overwhelming
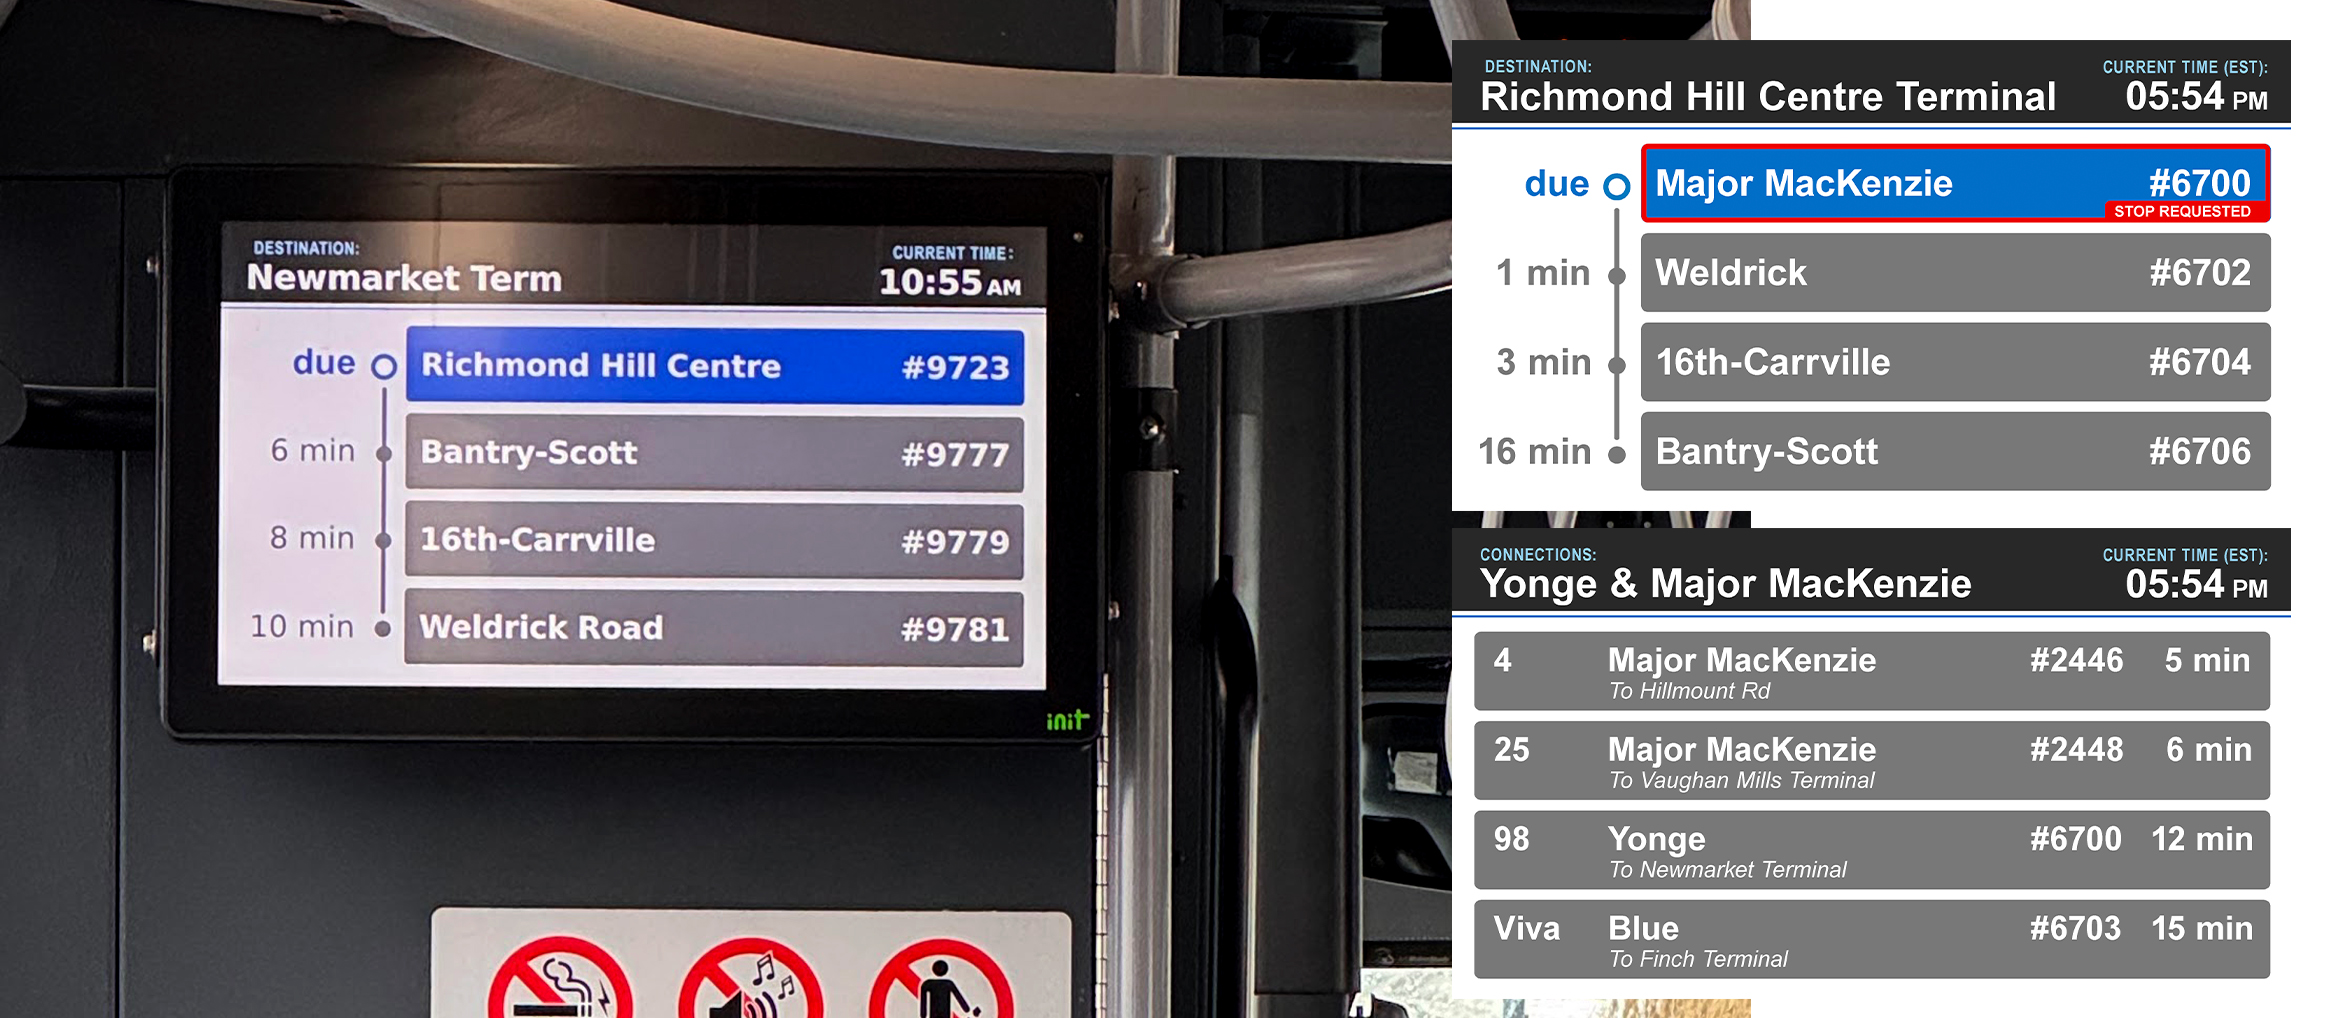
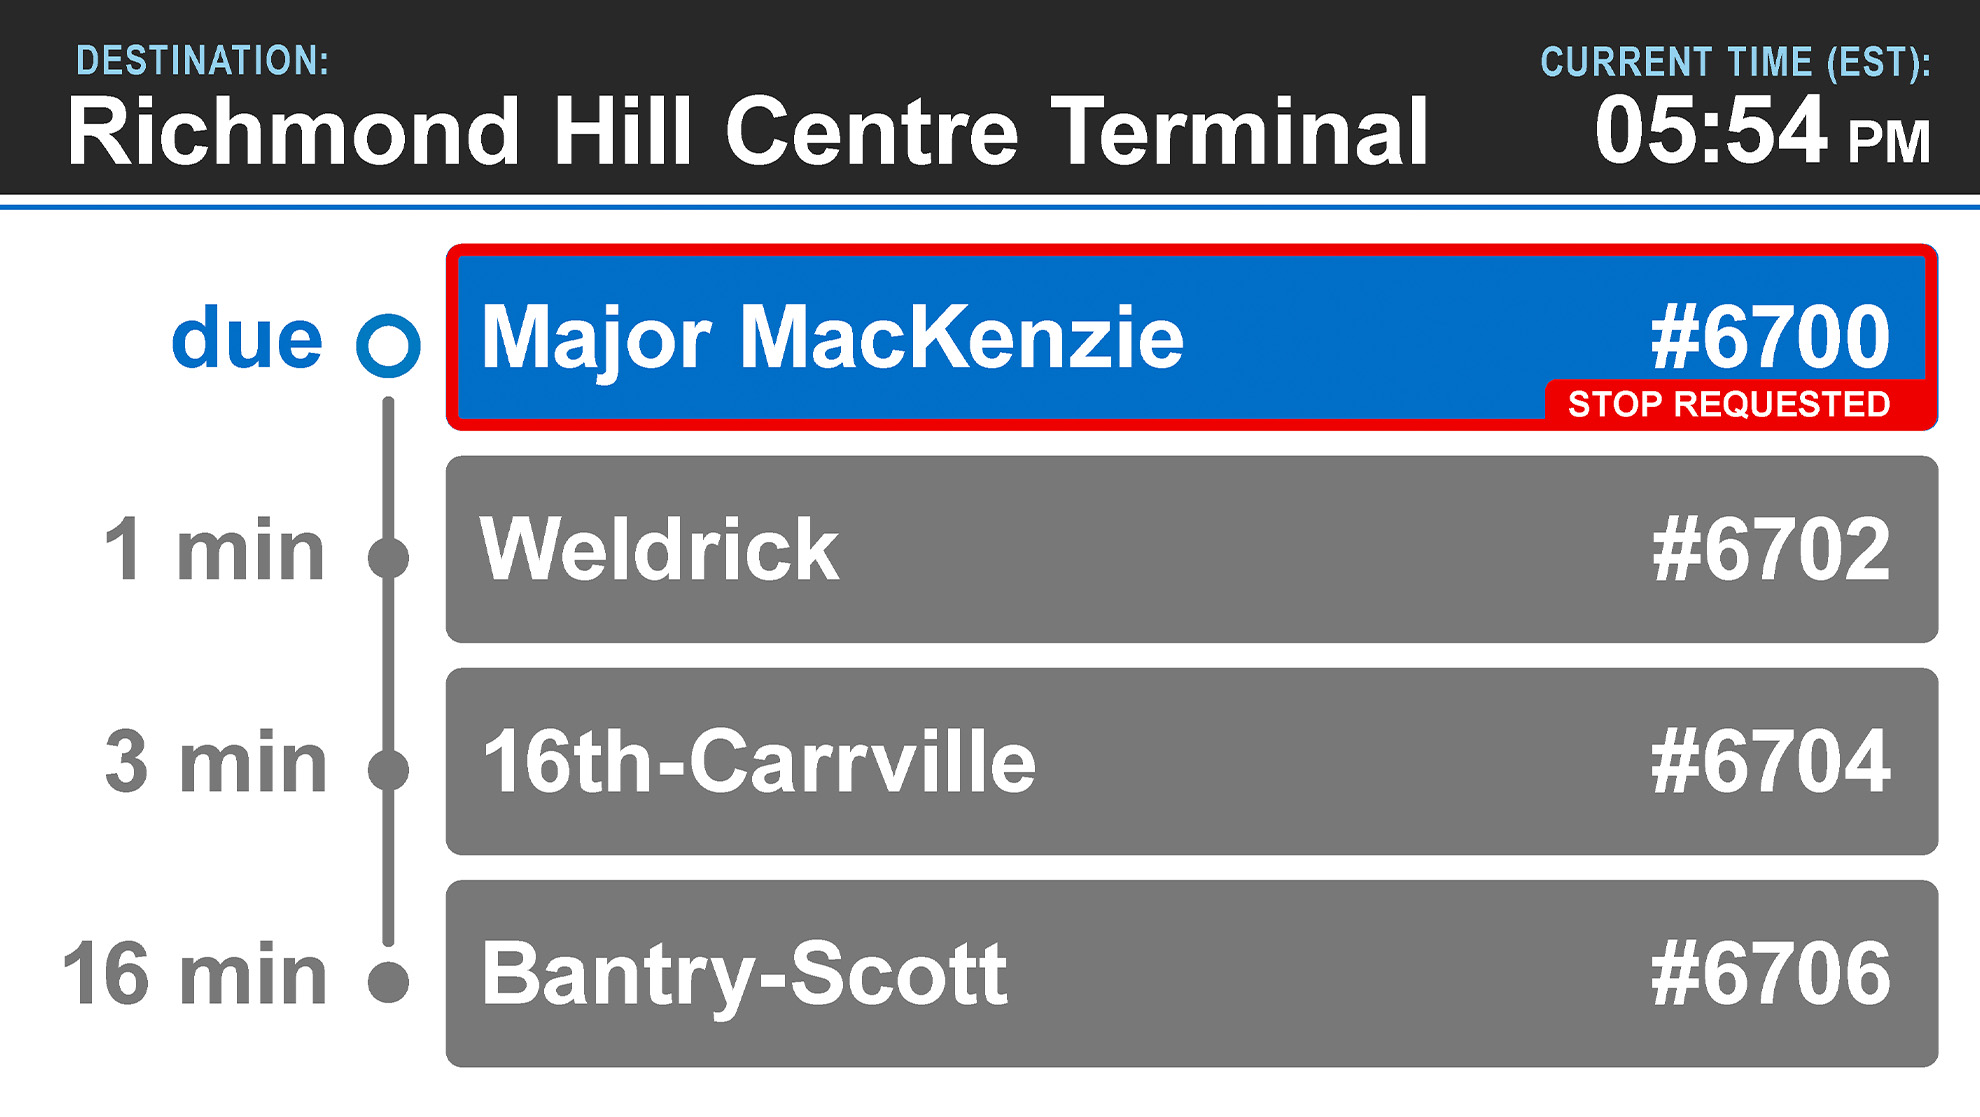
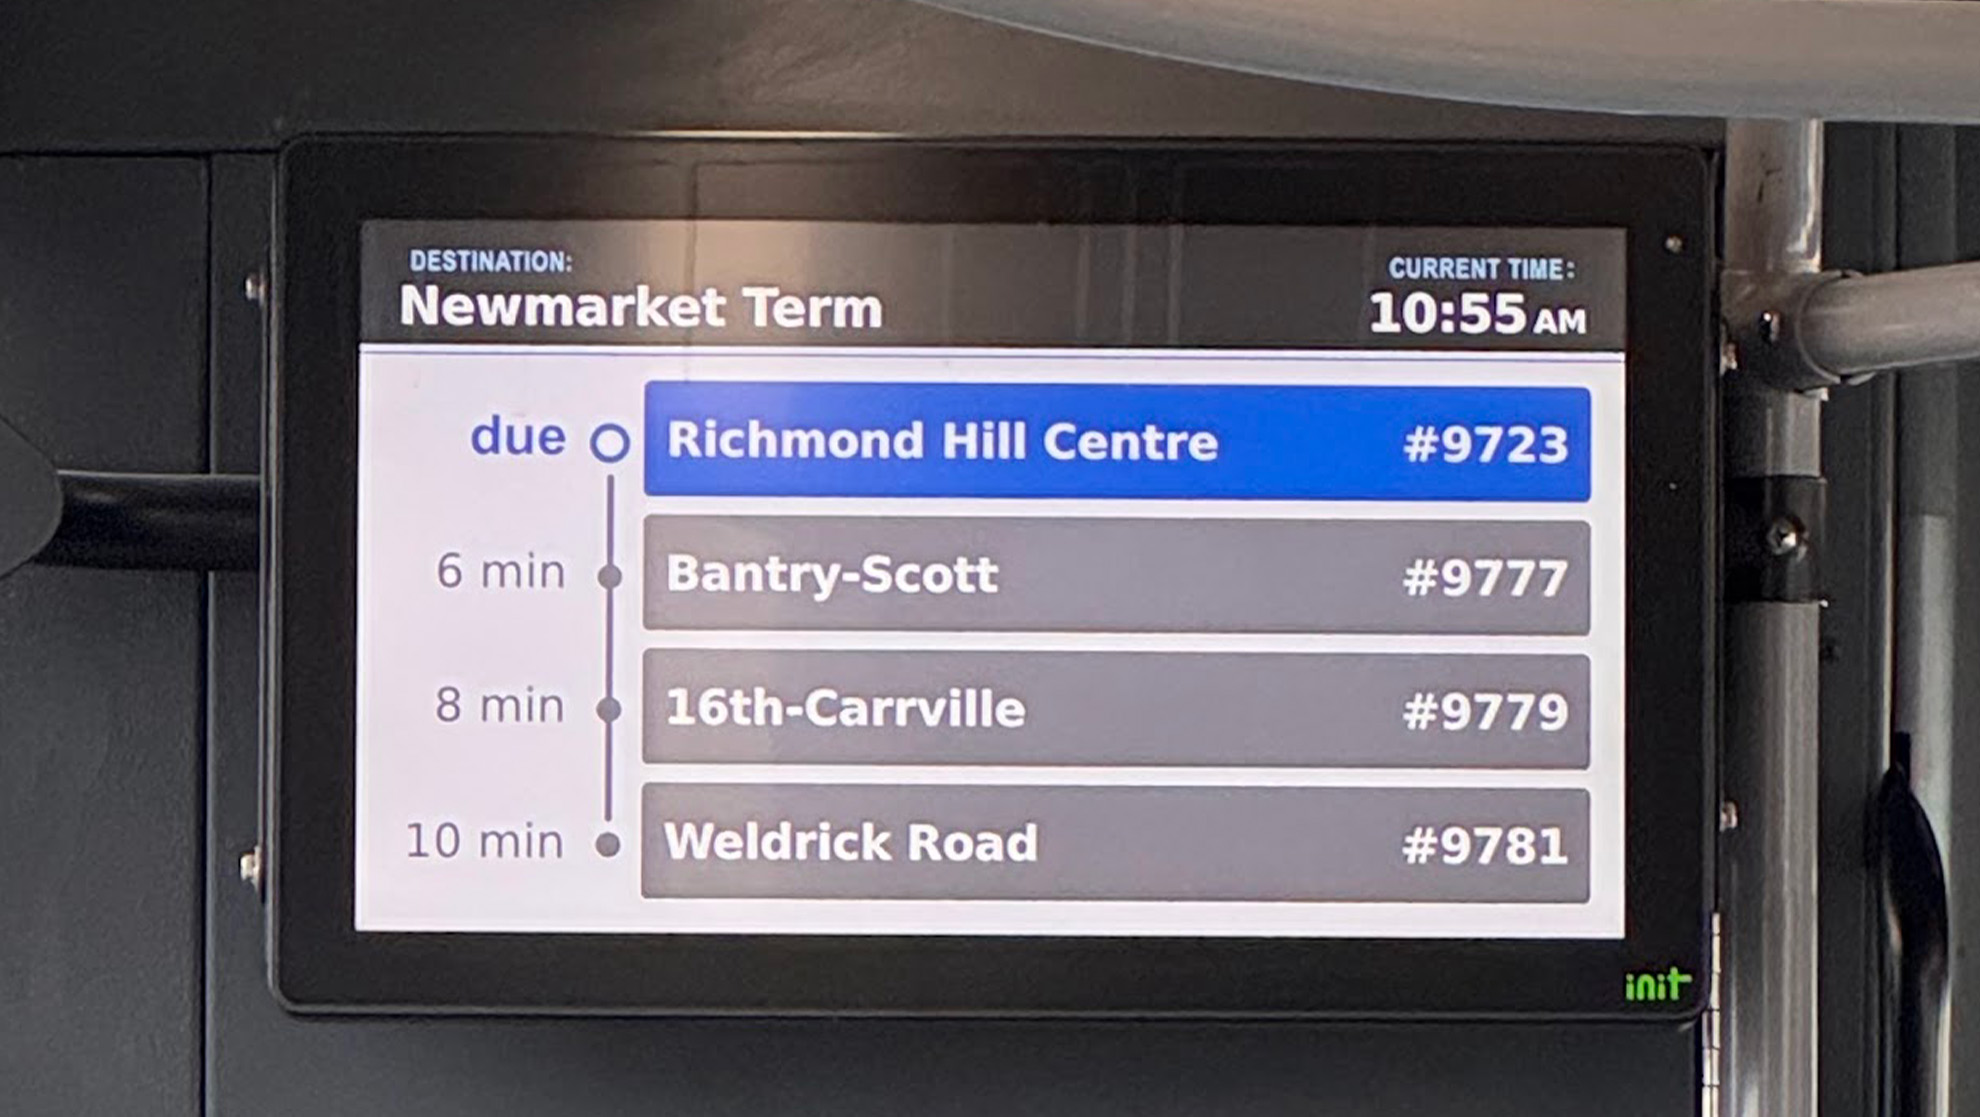
New on-bus LCD screens were installed to improve on the existing VMS signs, which could show only one stop. I emphasized the upcoming stop and greyed out the ones after, keeping a contrasting “Stop Requested” red indicator to match the legacy signs and tested type sizes against the longest names so they’re as readable as possible from the back of a 60-foot articulated bus.
Outcome
- In service across 500+ vehicles and 15 transit facilitiesDesigns are currently in use across YRT fleet and transit locations, including TTC subway stations that connect to YRT services.
- Templates that work within backend limitsRefreshed designs put the most important information first, and many long destination names now display in full without truncation.
Reflection
Looking back, I wish I had mapped out which designs would run on which hardware, and where they are physically installed on site. Not every display was replaced, so terminals ended up with a mix of old and new screens in different sizes, and I couldn’t always tell how the design would look in its environment. That matters for wayfinding, since a screen isn’t judged on its aesthetics alone, but on whether a commuter can read it from where they’re standing, mid-transfer or on the go.